
CASE STUDY 02 / 04
Digital Operations Analytics for Industrial Services
An operating analytics foundation that moves industrial-service management from manually assembled monthly reports to consistent, queryable daily intelligence.
This case separates the implemented structure, my personal contribution and the boundary of what can be shown publicly.
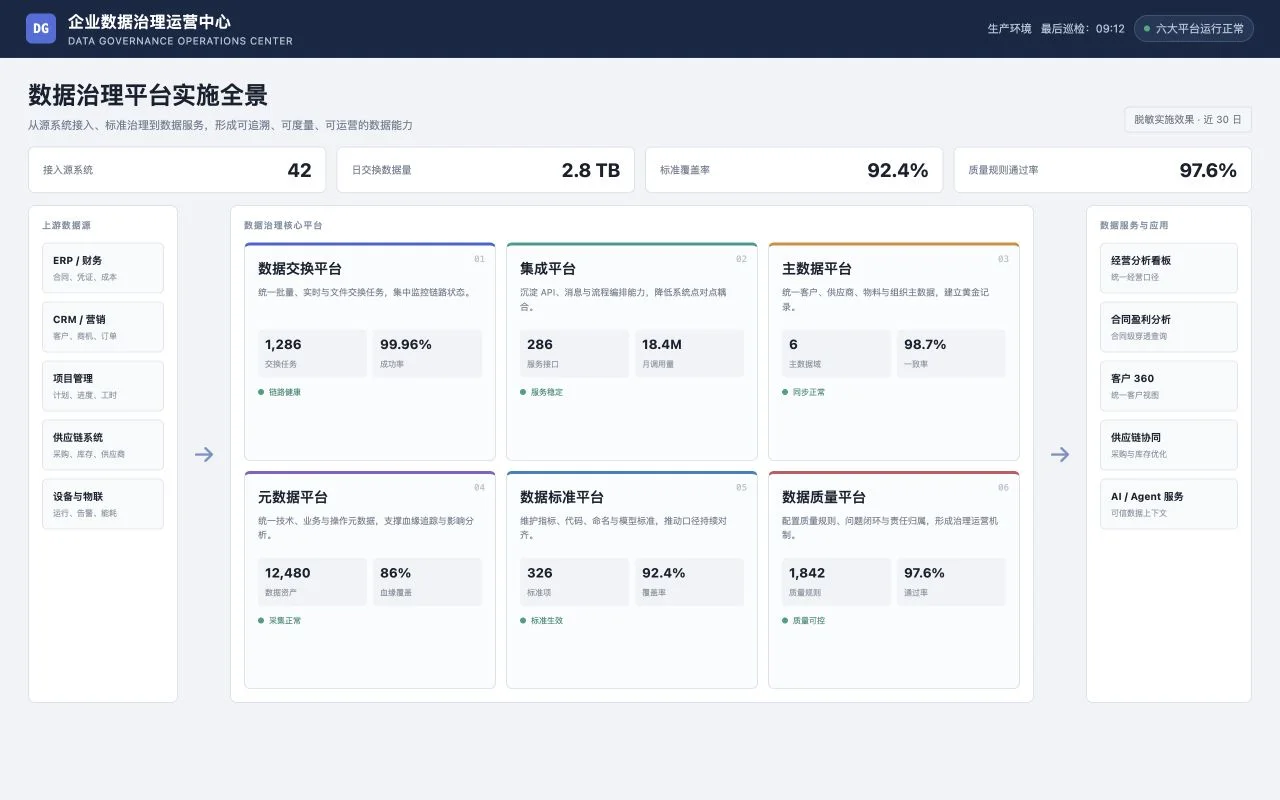 Anonymized reconstruction
 01 System Narrative
Problem, structure and delivery.
Operating problem
Operating analysis depended on manually assembled monthly reports. The chain was slow, departments maintained conflicting definitions, and management could not inspect the business with consistent daily context.
Delivery path
Used operating metrics to drive the sequence: align definitions, establish maintainable pipelines and warehouse layers, then deliver role-specific dashboards as a daily management capability.
System structure
Data pipelines provide repeatable ingestion and cleansing, subject-oriented warehouse layers preserve structure, a governed metric layer owns definitions, and role-specific dashboards serve management decisions.
02 Decision Record
The trade-off behind the interface.
- Constraint
- Monthly reporting was slow and different management roles needed different views, while the underlying metric definitions had to remain consistent across every interface and delivery phase.
- Alternatives considered
-
- 01 Keep adding one-off reports
- 02 Buy a dashboard tool before resolving the data foundation
- 03 Let governed metrics drive the data foundation and role-specific views
- Why this choice
- Chose a metric-first sequence: establish a maintainable dictionary, build the pipeline and warehouse layers, then deliver decision views by management role.
- My contribution
- Owned the program plan, metric system, delivery priorities and visualization while translating continuously between operating language and data architecture.
- Result and reuse value
- Shifted management discussion away from reconciling numbers toward interpreting operations, with a structure that can expand by subject and role.
- Public evidence boundary
- The public view is an anonymized reconstruction of the implemented structure. Organization names, platform states and operating data are demonstration content rather than live production values.
03 Impact
What remained after delivery.
- Shortened the path from monthly assembly to queryable operating views
- Established shared metric definitions across participating teams
- Made operating issues visible earlier in the management cycle
- Left a maintainable analytics capability rather than a one-off report
Next Case
Local-first AI Agent Workspace